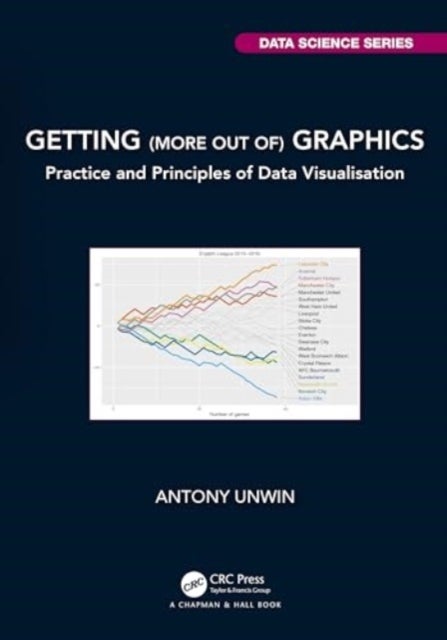
Getting (more out of) Graphics av Antony (University of Augsburg) Unwin
789,-
<p>Data graphics are used extensively to present information. Understanding graphics is a lot about understanding the data represented by the graphics, having a feel not just for the numbers themselves, the reliability and uncertainty associated with them, but also for what they mean. This book presents a practical approach to data visualisation with real applications front and centre.</p><p>The first part of the book is a series of case studies, each describing a graphical analysis of a real dataset. The second part pulls together ideas from the case studies and provides an overview of the main factors affecting understanding graphics.</p><p>Key Features:</p><ul><li>Explains how to get insights from graphics.</li><li>Emphasises the value of drawing many graphics.</li><li>Underlines the importance for analysis of background knowledge and context.</li></ul><p>Readers may be data scientists, statisticians or people who want to become more visually literate. A knowledge of Statistics is n

Relaterte produkter
Vis flereVi har valgt ut en rekke interessante produkter i samme kategori som Getting (more out of) Graphics av Antony (University of Augsburg) Unwin. Hvis du ikke finner noe interessant her kan du enkelt klikke på “vis flere”.


Produktinformasjon
- Alle prisene nevnt ovenfor er oppgitt i Norske kroner.
- Dette produktet er tilgjengelig hos Norli NO.
- Hos Norli NO kan du kjøpe Getting (more out of) Graphics av Antony (University of Augsburg) Unwin for kun 789,-.
- Den laveste prisen på Getting (more out of) Graphics av Antony (University of Augsburg) Unwin ble registrert 17. februar 2025 kl. 14:48.
Prisutvikling
Er den nåværende prisen et godt tilbud?
Grafen over prisutviklingen viser den laveste prisen over tid, eksklusiv fraktkostnader.
Prishistorikk for Getting (more out of) Graphics av Antony (University of Augsburg) Unwin
Laveste pris
789,-
17 feb. 2025
Høyeste pris
789,-
17 feb. 2025